

The brief
Hyundai wanted to increase foot traffic to their dealerships by maintaining a full-year campaign that promoted the brand’s flagship models and featured “open house” highlights.
To meet these objectives, Hyundai, its agency Ekstend, and Locala developed a multi-local Drive To Store strategy based on 17 activations spread over the year to support 202 dealerships across the country.
The Strategy
LocalAudience:
- Identify high-potential areas for each dealership.
- Create 3 geo-targeting distribution groups (urban, suburban and rural) for a consistent activation at the local level.
- Activate 7 relevant affinity segments based on consumption habits or models (hybrid or electric cars enthusiasts, competition or by model…)
LocalActivation:
Launch 17 activations throughout the year:
- 12 campaigns for Hyundai range or flagship models
- 5 campaigns in support of “open house” operations between March and September
Creative approach :
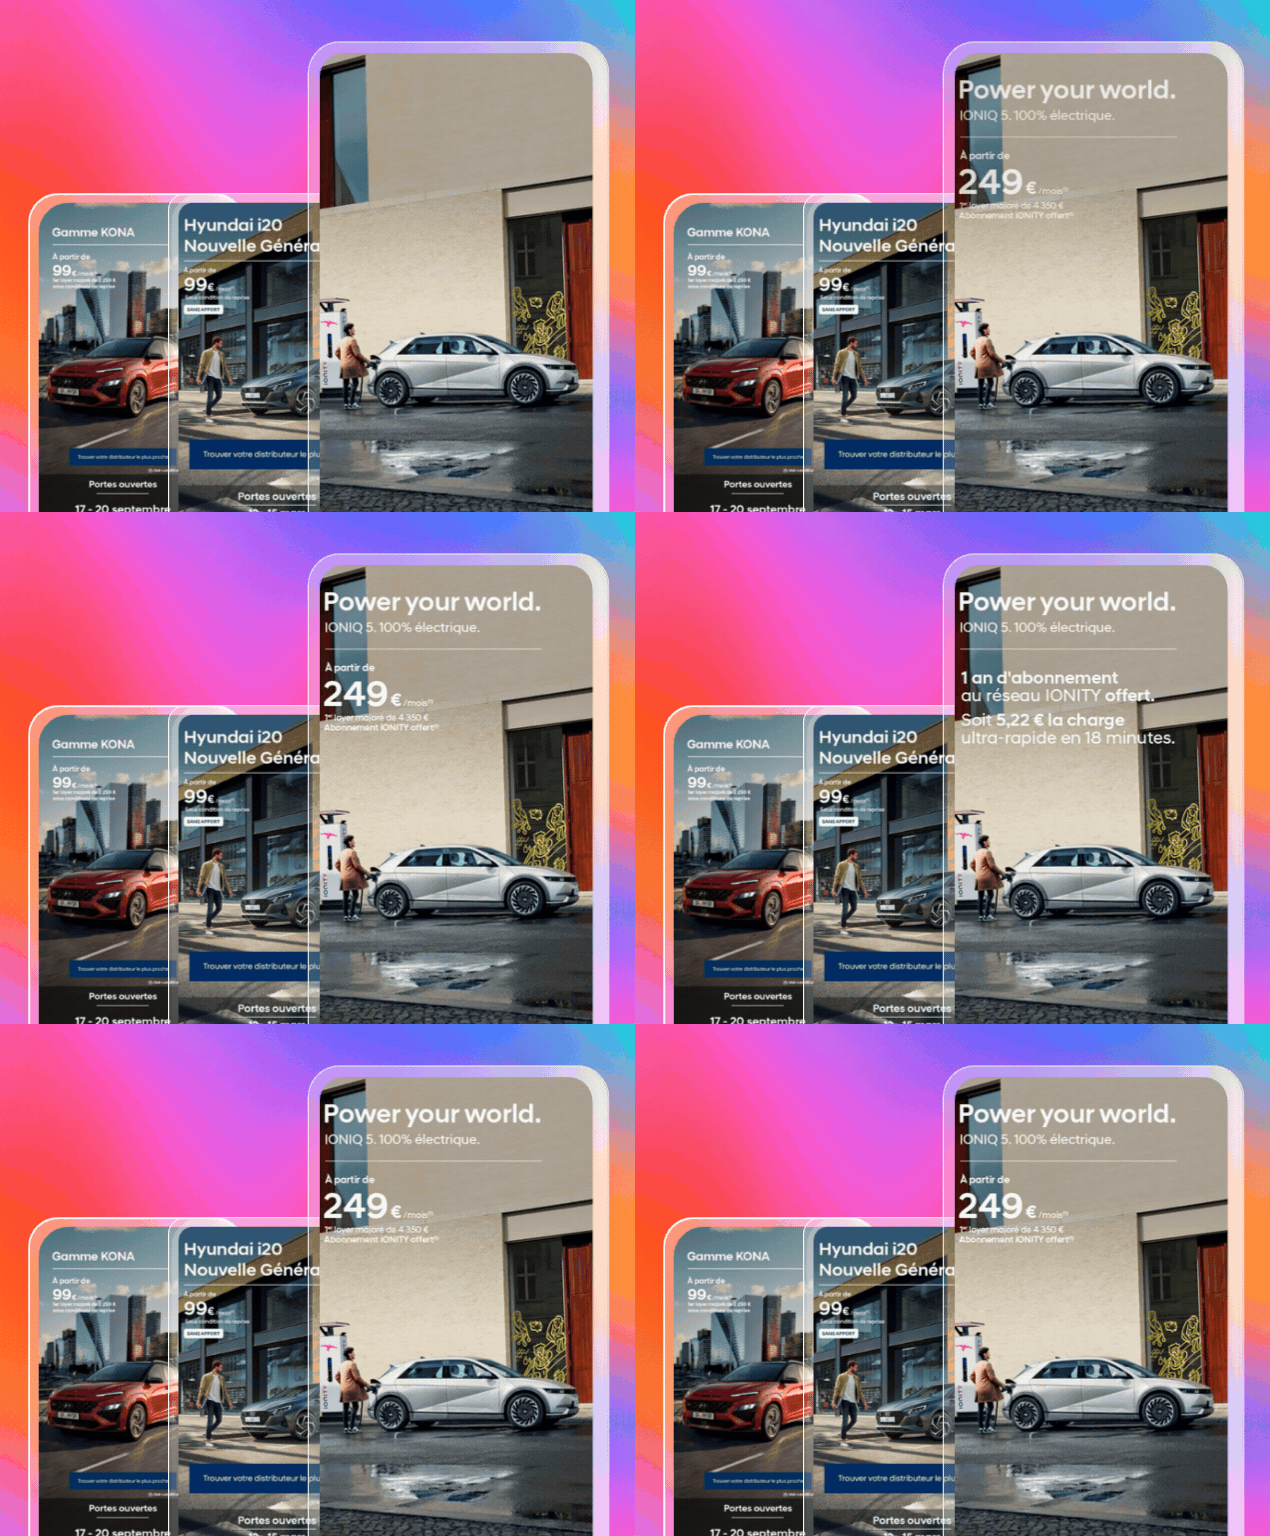
- Deployment of branding formats (CPU, Interstitials…) featuring the price of the models as the main focus.
- Highlighting event formats to announce open houses and trigger purchases (Countdown, Mosaic…)
Retarget audiences exposed to previous messaging to multiply the number of touchpoints and optimize the performance of the open house.
LocalAttribution:
Integration of a dynamic pixel to measure the performance of each activation in real time.
LocalAnalytics:
Locala provided valuable insights for Hyundai to test and optimize each campaign throughout the year.
- Audience: 2 audiences, Guerilla (competitor) and intentional electric vehicle and hybrid, stand out as best performers in drive-to-store.
- Format: The most ROI-effective format was the interstitial on the flagship models and on open houses.
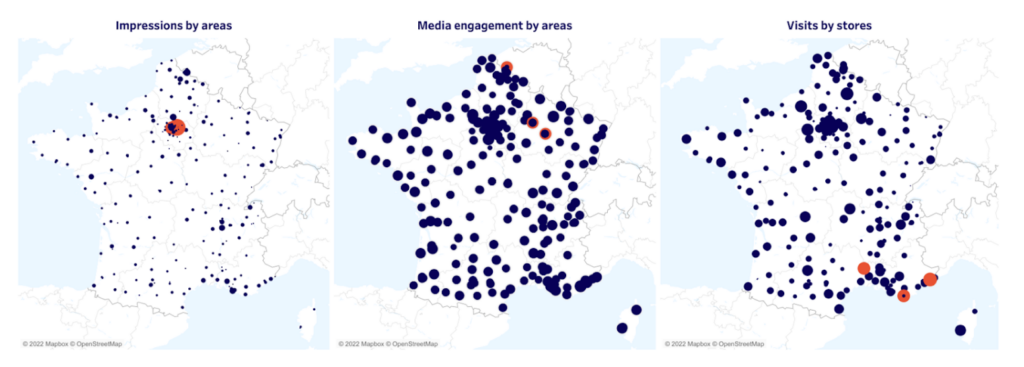
- Group distribution by zone: Distribution by group enabled us to cover the entire territory in a similar way, both in terms of impressions delivered and the rate of engagement, allowing us to balance the visits generated in each zone.
The Results
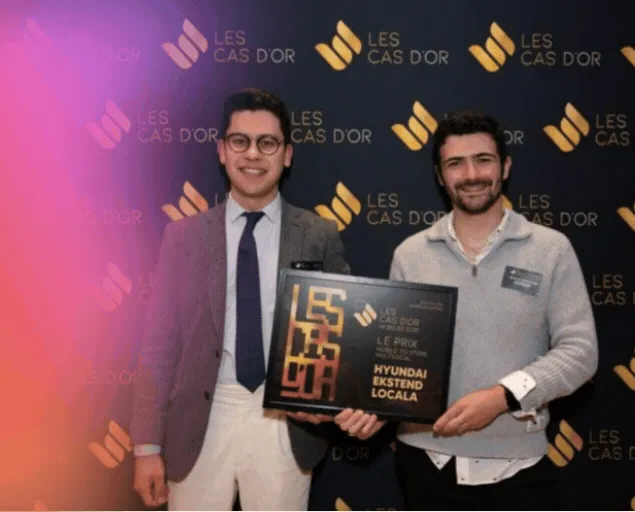
Award
This campaign received the GOLD award in the “Mobile-to-store” category awarded by Les Cas d’Or in partnership with Alliance digitale.