Growth Opportunity
Market Pressure
High Engagement
Retention Gap

Agents of a World
in Motion

The Operating Layer for Adaptive Advertising
Locala enables leading brands to act on business and consumer reality, market by market, where it matters.
Outline of a heart shape icon in black on white background.
Competitive Pressure
Simple black sketch icon of a small store with an awning and doorway.
Store Performance
Icon of a column chart with four vertical bars of varying heights.
Consumer Demand
Black upward trending arrow graph icon on white background.
Brand Strength
Outline of a person icon with a star symbol on the right side.
Online Consideration

Markets move.
Media plans should too.

Yet most advertising still runs on static audiences, static plans, and static execution…
 applied nationally, regardless of what's actually happening on the ground. A national strategy creates more value when it adapts to each territory.

Markets move.
Media plans should too.

Yet most advertising still runs on static audiences, static plans, and static execution…

applied nationally, regardless of what's actually happening on the ground.

A national strategy creates more value when it adapts to each territory.
Simple black heart outline icon on white background.
Competitive Pressure
Black arrow chart icon indicating upward growth or increase.
Brand Strength
Black shopping bag icon with a handle and a rectangular base.
Store Performance
Three vertical bars in a column chart increasing from left to right with a base axis line.
Consumer Demand
Outline of a person next to a star icon.
Online Consideration
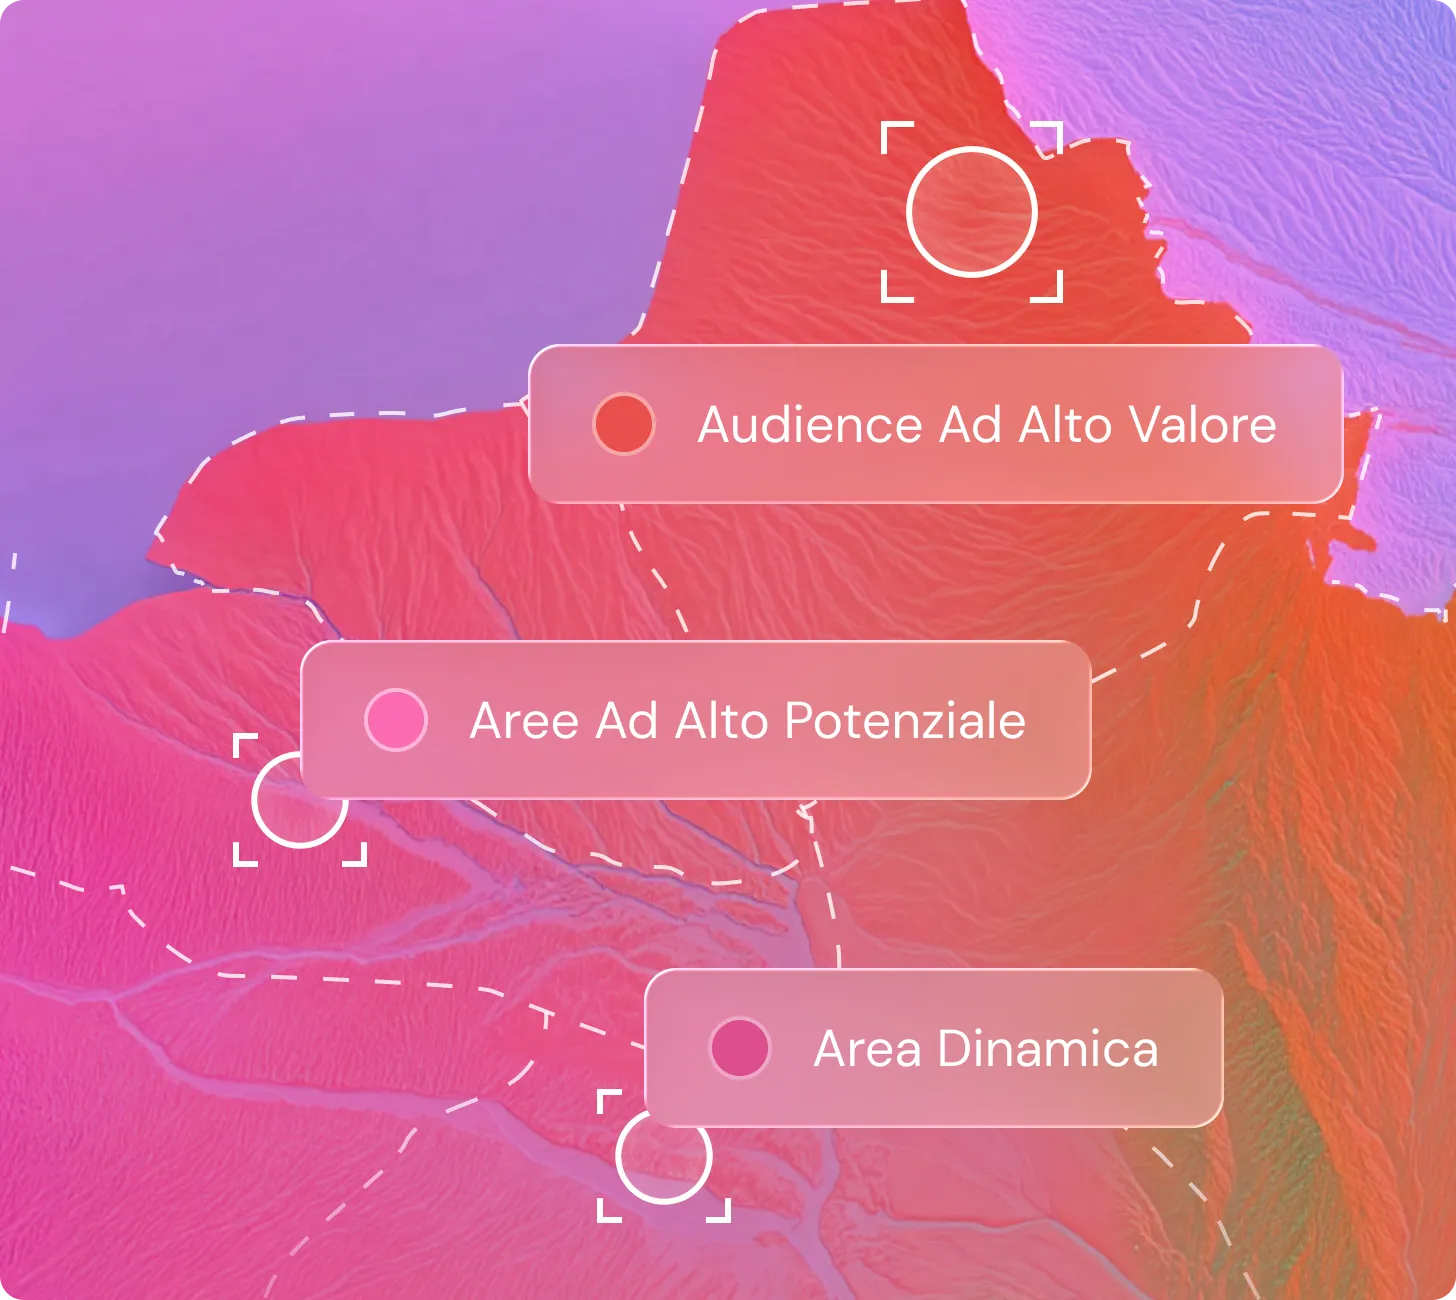
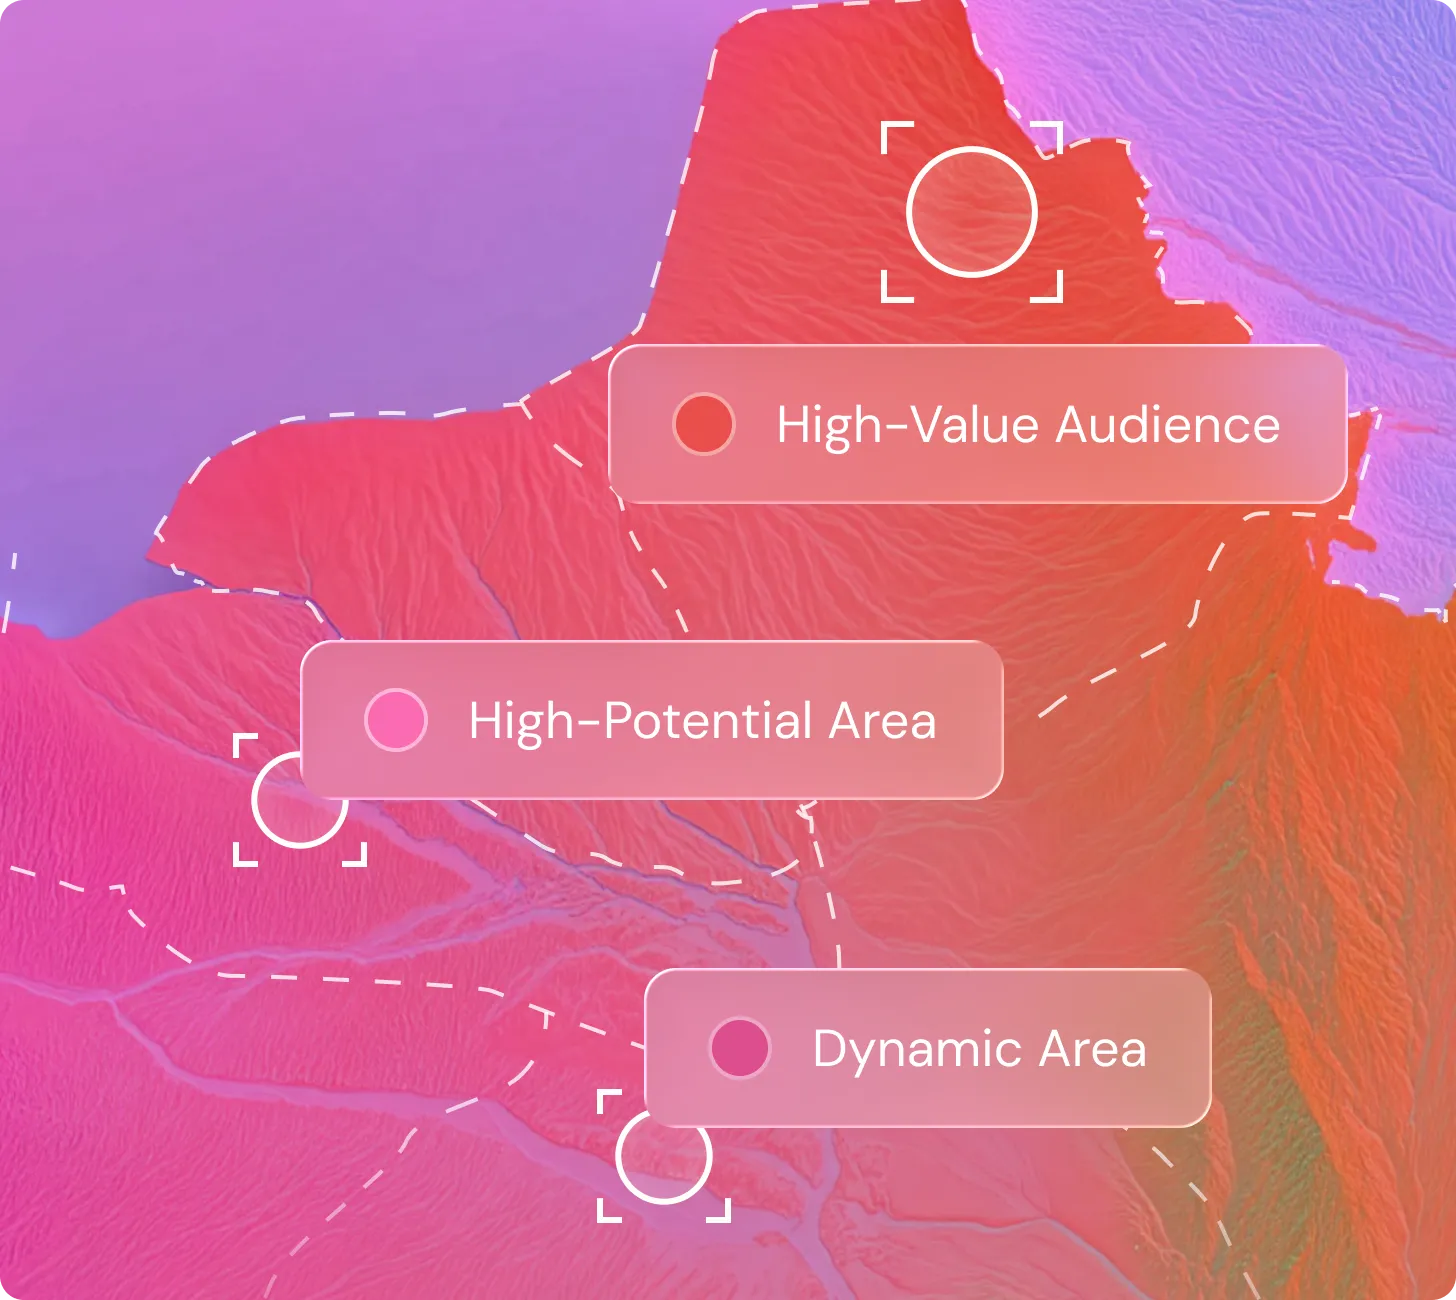
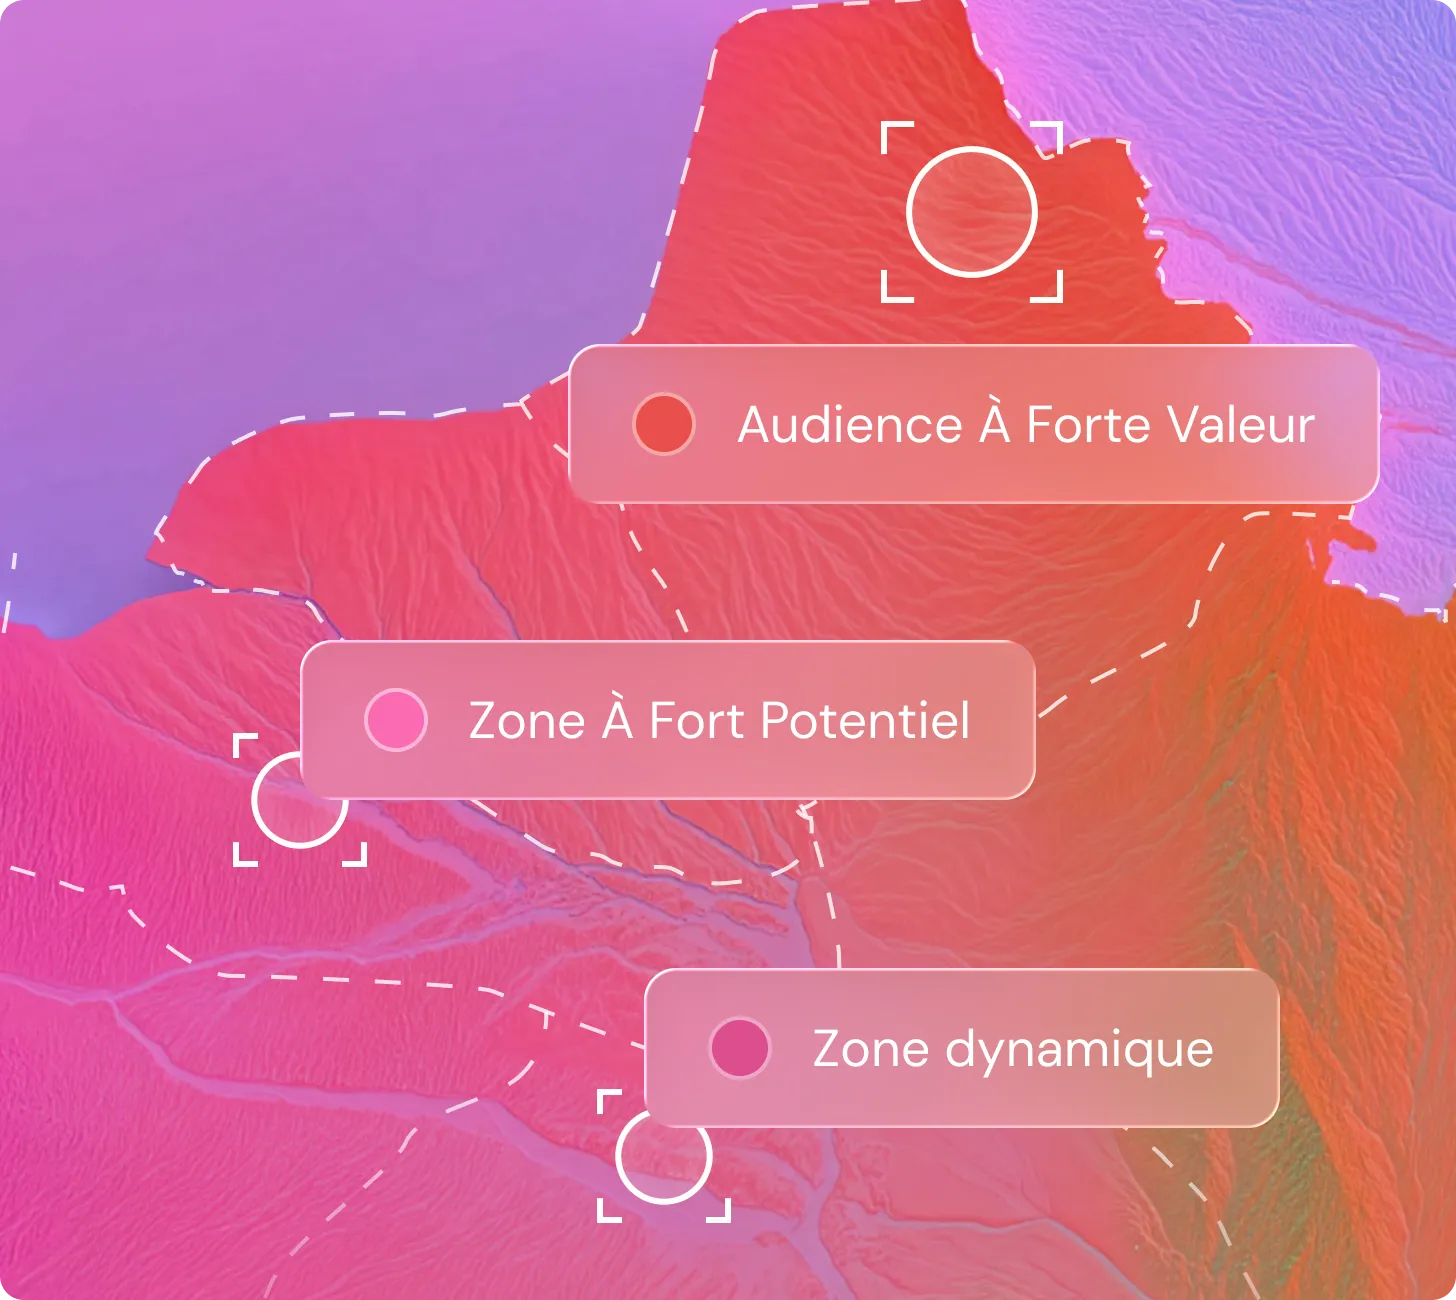
Colored map with three highlighted regions labeled with Italian terms: a red area labeled Audience Ad Alto Valore, a pink area labeled Aree Ad Alto Potenziale, and a darker pink area labeled Area Dinamica, each marked by circular focus icons.Color-coded map highlighting High-Value Audience, High-Potential Area, and Dynamic Area regions.Color-coded map with three highlighted zones labeled in French: a red zone marked 'Audience À Forte Valeur,' a pink zone marked 'Zone À Fort Potentiel,' and a darker pink zone marked 'Zone dynamique,' each with circular target-like markers and dashed boundaries.
A brand can lead in one market and lag in the next. 
Three blurred colorful human silhouettes with dotted line linking globe and store icons above.
Online strength doesn’t guarentee offline conversion.
Abstract colorful landscape with three groups of translucent bars linked to store icons above each cluster.
Competitive pressure shifts locally.
Smiling woman with curly hair looking at a mobile phone, colorful abstract overlay.
Consumer behavior looks different from one market to the next.
Color-coded map highlighting High-Value Audience, High-Potential Area, and Dynamic Area regions.Color-coded map with three highlighted zones labeled in French: a red zone marked 'Audience À Forte Valeur,' a pink zone marked 'Zone À Fort Potentiel,' and a darker pink zone marked 'Zone dynamique,' each with circular target-like markers and dashed boundaries.Colored map with three highlighted regions labeled with Italian terms: a red area labeled Audience Ad Alto Valore, a pink area labeled Aree Ad Alto Potenziale, and a darker pink area labeled Area Dinamica, each marked by circular focus icons.
A brand can lead in one market and lag in the next. 
Three blurred colorful human silhouettes with dotted line linking globe and store icons above.
Online strength doesn't guarantee offline conversion.
Abstract colorful landscape with three groups of translucent bars linked to store icons above each cluster.
Competitive pressure shifts locally.
Smiling woman with curly hair looking at a mobile phone, colorful abstract overlay.
Consumer behavior looks different from one market to the next.
arrow to the leftarow to the right
Woman walking through a busy city street with blurred people and buildings around her, overlaid with a dashed line connecting icons of devices and labels showing +26% Ad Attention, +71% Brand Preference, and +30% Store Visits.

Adaptive Advertising

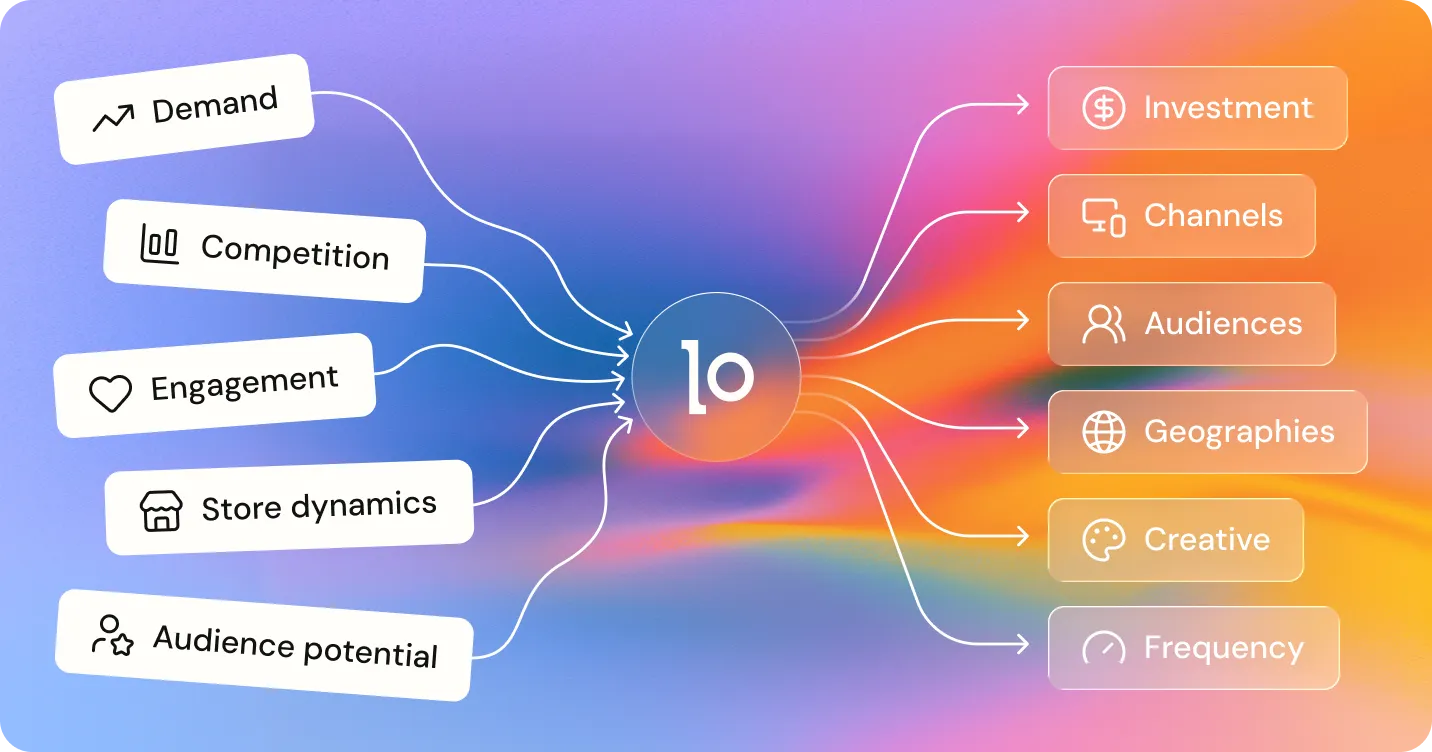
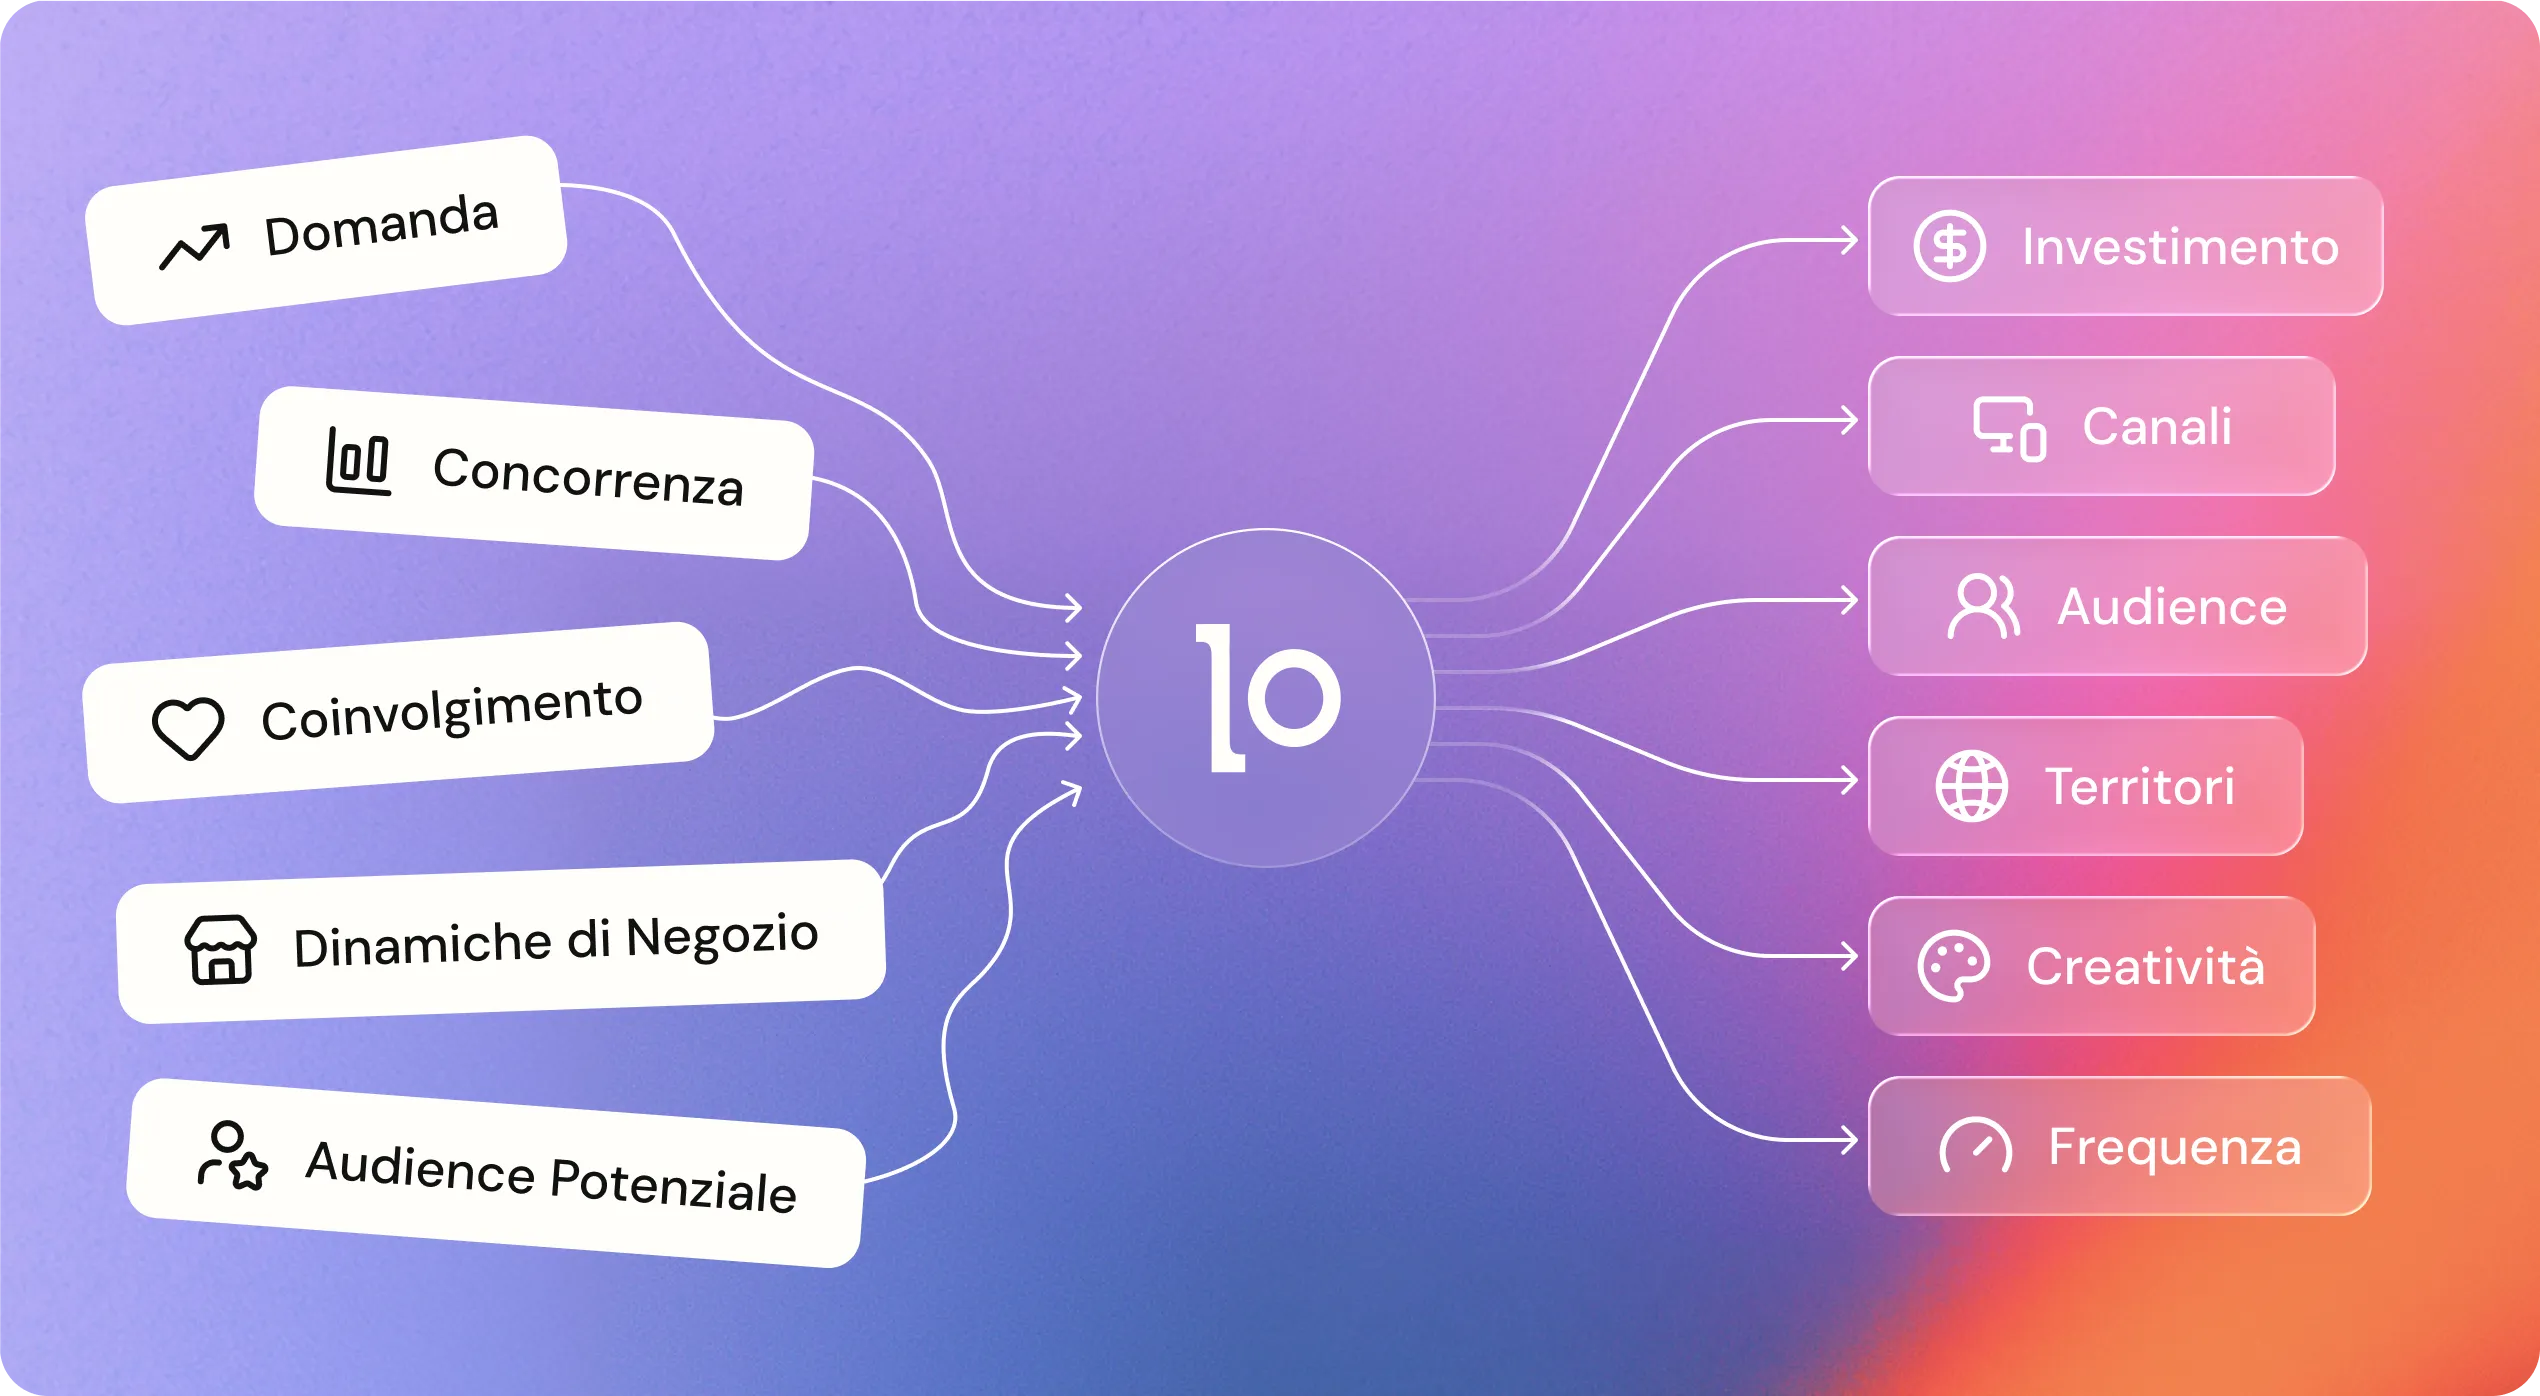
The ability to continuously adjust media, audience, geography, creative, and investment based on changing business and consumer reality, market by market.
Diagram showing inputs like demand and engagement feeding into a central icon, outputting investment and channels.Concept diagram with a central circle labeled 'lo' connected by arrows to two groups of labeled boxes: on the left side, boxes with icons and French text reading Demande, Concurrence, Engagement, Trafic en magasin, Potentiel d'audience; on the right side, boxes with icons and French text reading Investissement, Canaux, Audiences, Géociblage, Formats, Reach.Diagram showing a central circle labeled 'lo' with arrows pointing from five factors on the left—Demand, Competition, Engagement, Business Dynamics, Potential Audience—to the circle, and arrows from the circle to six factors on the right—Investment, Channels, Audience, Territories, Creativity, Frequency, each paired with a relevant icon.
Adaptive Advertising means reading what's moving in a market (demand, competition, store performance, audience behavior) and adjusting what you do about it (where you invest, which channels you use, which audiences you target, which creative you show). 

Most adtech can observe, or execute. 

Adaptive Advertising requires both, connected continuously.

Locala is the Operating Layer for Adaptive Advertising.

Icon of a square with rounded corners containing three horizontal lines stacked vertically.
Simple black megaphone icon on a white background.
Simple open book icon with curved pages in dark gray on white background.
Three layered process diagram with Plan, Activate including media types, and Learn showing ROAS values.Three translucent layered discs representing a workflow: the top disc labeled Plan with document icon, the middle disc labeled Activate featuring icons for Social media, Audio, Video, Display, CTV, and DOOH, and the bottom disc labeled Learn showing ROAS 3.2x metrics with graph lines.Three floating translucent circular layers arranged vertically representing a process: the top labeled 'Plan' with network-like lines, the middle labeled 'Activate' connecting media types including Social media, Audio, Video, CTV, DOOH, and Display, and the bottom labeled 'Learn' showing three ROAS metrics reading 3.2x on a colorful blurred cityscape.

A proven methodology, trusted by over 1,000 global brands.

+25%
more attention, compared to industry standards
+70%
higher brand preference, compared to industry standards
+30%
more store visits, average campaign uplift